Why do we build logistics models?
This is obviously a rhetorical question. But I ask it because modeling often takes a detour into the land of debilitating detail. And by debilitating, I mean an enormous analytical time sink — think months. I am often asking clients whether they wish to:
A) Model the precise general ledger costs for logistics?
or
B) Make a well-researched decision?
If you chose “A” you can stop reading because the rest of this blog post is about why that will lead you down the wrong path.
At the surface “A” and “B” seem to follow one another. If I am making a good model, am I not accurately modeling my future logistics spend? Yes, with a big BUT… the precision required to make a perfect model of your financial spend can often lead you to a create a model that is erratic. Let us look at this a little deeper and see where the “precise” and the “good” deviate in a classic logistics model.
What is a Good Logistics Model?
A good logistics model is designed to predict the future. Yet a modeler will always start with a calibrated baseline. And the “calibrated” part of this refers to accounting costs — those costs found in an organization’s financial database. The theory goes that if a model shows the same costs as the current state, then we can trust that it will show appropriate differences when changes are modeled.
A logistics model can be as complex or simple as a modeler wishes, however it always needs to be believable and grounded in the actual costs of a system. This blog post should make one thing clear to the modeler: the search for “accounting” level accuracy can stand in opposition to your actual goal — making a supply chain decision. It will not only cost you time to build this “perfect” supply chain model, but it will also imbed imperfections into the very mechanism of the model.
What Makes Fiscal Accounting Accuracy Popular?
People gravitate to their accounting numbers because of comfort — pure and simple comfort. General ledgers do not need to be explained. They reflect actual expenditures — they are immovable facts of history. They are also safe. Executives and managers alike believe their general ledgers. No one gets sent out of a conference room for repeating known accounting numbers to a group. But the actual spend last year has lots of little aberrations.
How Can Accounting Costs Lead You Astray?
Accounting costs can look very detailed and accurate; take an entry for an individual shipment of your product, for example. You can see the units, weights, and most importantly, the costs. These costs go directly into the accounting system. These show exactly what was paid net of discounts, accessorial, and anything else that might be tacked on.
This means that for every origin and destination that has shipment activity, we should have a highly accurate cost for the organization’s shipment down that lane… right?
Let me share experience from hundreds of modeling exercises. If we treat a shipment table as the definitive cost for each lane, we run into three problems with our model:
1. Lack of statistical significance
2. Heterogeneous data
3. GAAP accounting methods
Let’s delve into each one of these.
1. Statistical Significance — If I have a number, how can it be wrong?
Let’s say you have data on hundreds, or even thousands, of trucks you paid for last year. How could this vast amount of real data go wrong? When you break them down by lane, season, and method of purchase, thousands of data points might turn into five to ten data points for a given lane — or sometimes only one shipment. As a reminder from that long-forgotten statistics class, statistical significance for a single variable starts at seven data points — just to be roughly correct.
Now go further and ask yourself:
– Does your shipment data have a mix of spot and contract shipments?
– Are there data points for every season? Note: trucking in some regions has significant seasonality.
– Is there selection bias? Your buyers or your 3PL might be taking advantage of opportunistic contracts— trucks that were cheap for a single event, but do not reflect the market price next year.
You may have a wealth of data in aggregate but not at the level you need. Here is a way to test its value to a model — take a sample set of data for a given region and given season. Find the average and standard deviation by individual origin and destination. The variation will probably be large — I base this on my experience. The danger is that this variation is dropped from analysis once the average is found. Do some statistical sniff tests, you will probably be very disappointed in the value of this data in predicting your future spend on a lane-by-lane basis.
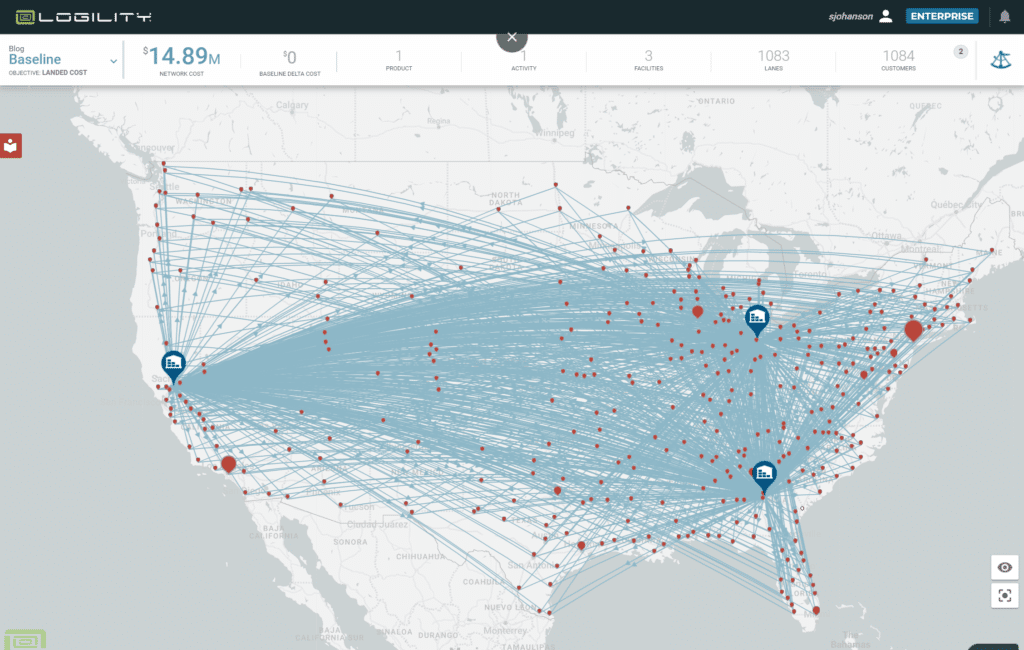
Figure 1 below visually displays what historic data looks like in an actual model. The total cost of the network exactly matched the accounting cost of $6.97MM. You can see three warehouses and almost every warehouse shipped to each destination city. We should have lots of real historical date, no need to fill in the blanks.
Here is where it goes wrong, Figure 2 is the same data set but optimized for the lowest cost supplier. Great, see how I saved $948K? Now look closely, find all the crisscrossed lines. Find the case where a customer node is right near the Alabama warehouse but is shipped from the Nevada warehouse.
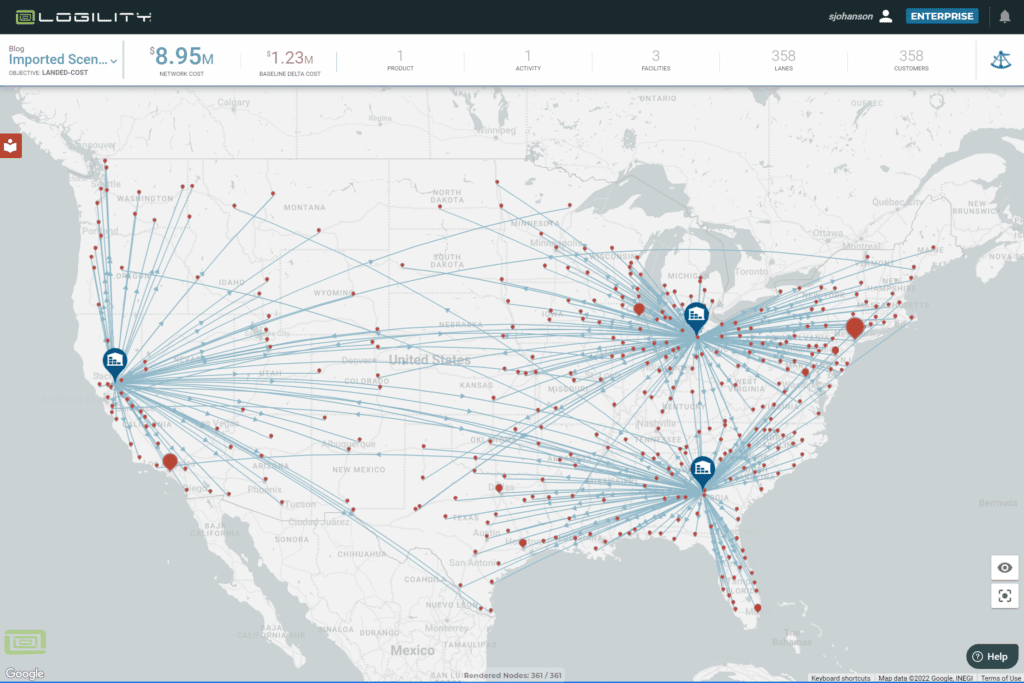
If it was not obvious before, you should now realize that optimization software acts like a passive aggressive child. If it can follow your instructions exactly and return nonsense, it will. In this case the analyst could go to each lane that did not make sense and exactly match it to actual average truck costs. Our wealth of data falls apart because lack of statistical significance throws off our model — we cannot rely on hundreds of records that present a solid average and we have not even started to add lanes that do not have any historical data.
2. Heterogeneous Data — how do you fill in the blanks?
The purpose of a logistical model is to answer “what-if” questions. This means something is going to change — a new port, new warehouse location, new route to the customer. Inevitably, key transportation lanes will not be found in the historical data. Modelers generally use three methods: quotes from carriers, regression analysis, and benchmark (market) data. Each of these methods will create three very different sets of data.
Carriers can provide quotes on contract and spot rates for a defined set of lanes. These will not match your historical costs because the carrier is predicting the future costs at the same time they are trying to secure your business. Many things might not match your past discount rates and accessorial charges. But with effort and enough quotes, you can get these to be “OK.” It will take time and you will have to do it every time you make a change in the model.
Regression analysis will turn a pile of data into a statistically significant formula. But it will also have inherent errors. Truckload rates are not uniform across any geography. An extreme example would be a port city like Los Angeles; more loaded trucks go out of Los Angeles than in. You will find that the cost from Phoenix to downtown LA is 42.5% the cost of a truck from LA to Phoenix. This is an extreme example, but you get the idea – regression formulas average out a lot of market subtleties.
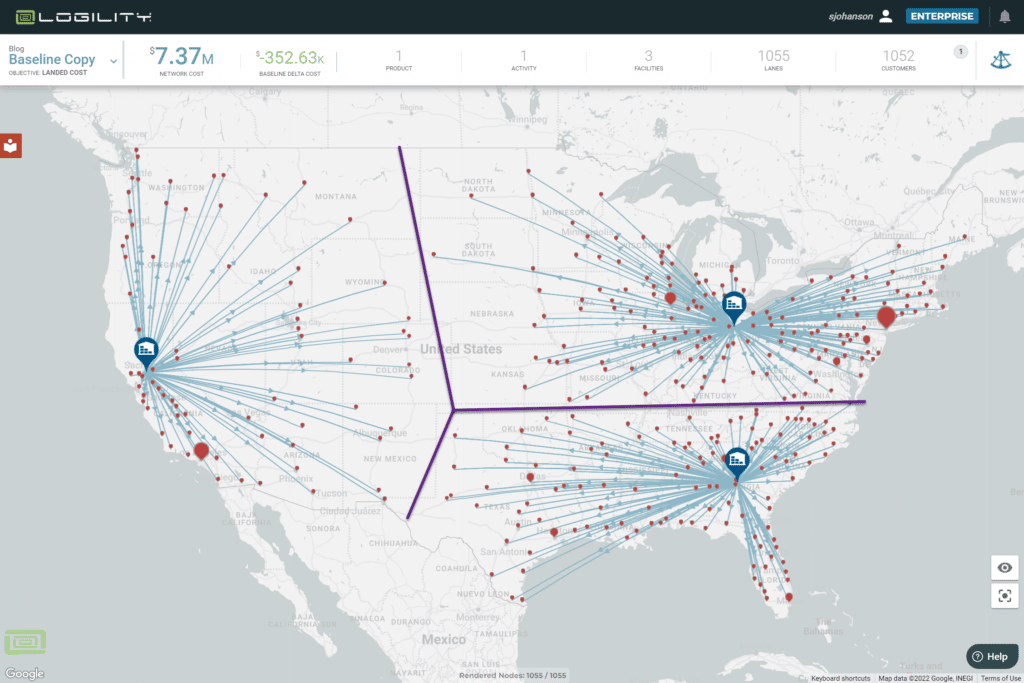
Figure 3 is an example of regression data input into the model. It makes the pretty picture you want to see — every customer is served out of its nearest warehouse. You can see the purple line showing the smooth lines of demarcation between service areas. This is easy to explain but is not correct.
The third data set is benchmark or market data which is really another measure of historic data, but it has the advantage of being historic data across hundreds of companies and millions of shipments. It will not match a company’s historic data precisely. But if everyone is buying from the same market you can assume that everyone’s rates will regress to the same market average.
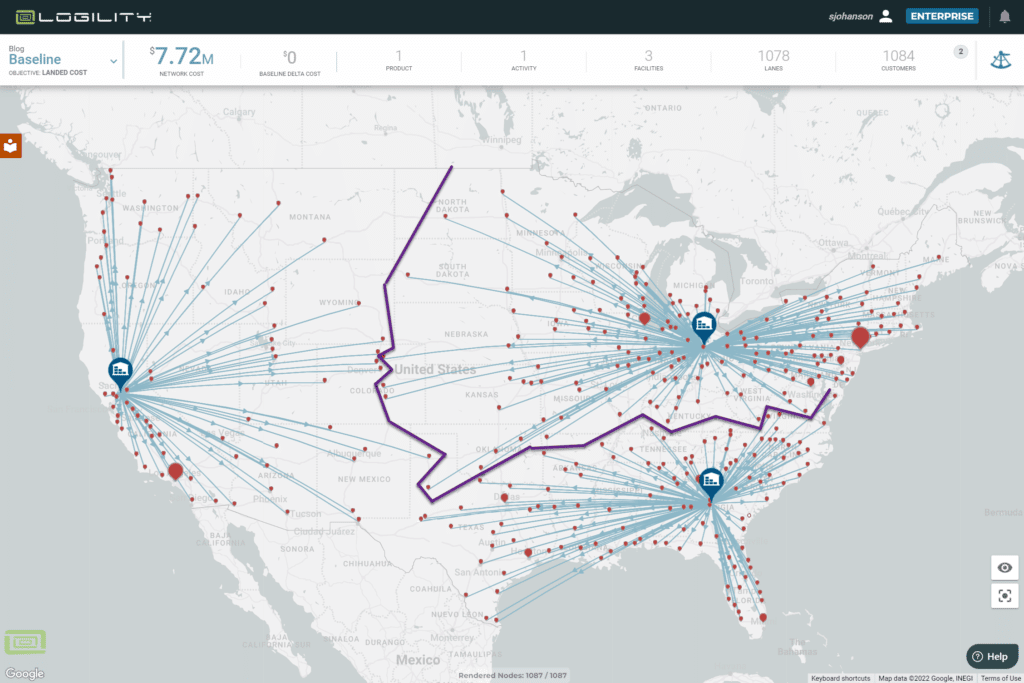
In Figure 4, you will see the customer-to-warehouse assignments are not as clean as the regression. But this is the real world and reflects the optimum use of the freight market. For example, trucks from Illinois going south are cheaper per mile than Alabama going north and east. This may be harder to explain to someone with this picture, but it has the advantage of being the most right.
Benchmark data also has the advantage of being the same set of data for known and unknown lanes You do not have to create a Frankenstein-like data model of mixed sources to fill in all the data you need.
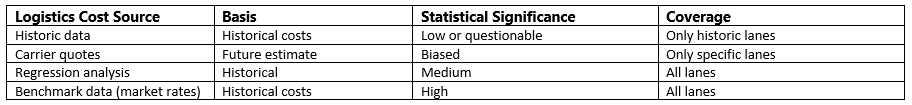
See the table below to describe the usefulness of different data sources.
Combining two or more sets of heterogeneous data across thousands of lanes requires a miracle of analysis to get them coordinated to the point that they do not mislead your analysis.
3. Cost Accounting — How can my numbers be wrong when they match my P&L?
Accounting is for accountants. Their objective is to balance all account totals at the end of each period. There are a lot of ways that transportation invoices are reconciled to their actual costs inside this time frame. These include corrections that might be taken at different times than the actual shipment or include discounts either ascribed to a shipment or again taken at a different point in the period.
Manipulating all the costs, corrections, and discounts to match each shipment can be an enormous task. If you total all the truckload, LTL, and Parcel shipments into a subtotal by mode, you can believe that summed number. However, if you want each of thousands of individual shipments to be properly costed, you have a lot of work to do and might need to get your accounting department to spend some quality time on your project.
What Should I Be Doing Instead?
The way to build a good supply chain model is to rely on long-term market figures and averages. You can buy them from any number of rate boards or Logility provides its own proprietary data set with its SaaS subscriptions. All you need do is calibrate these numbers to your business by “benchmarking” them against what you do know. Scale the market rates up or down and proceed to answering your question.
The true value of a logistics model will be that it trades off high-cost modes like LTL against low-cost modes like FTL. Or that inventory will be traded off against transportation. As long as your ratios are calibrated, you will get the right answer. And a good supply chain leader will value the right and defensible answer over detailed accounting precision — and they will appreciate that you answer the question sooner rather than later.
Additional reading:

Written by
Steve Johanson
SVP Industry Principal
Short bio
Steve Johanson is the SVP Industry Principal for network optimization at Logility, where he draws on 25 years of helping clients optimize their supply chains. Steve works with the Logility team to bring new and innovative solutions to the greater supply chain community and to help the client base build skills and knowledge to sustain competitive advantage.