Why do we build logistics models?

This is obviously a rhetorical question. But I ask it because modeling often takes a detour into the land of debilitating detail. And by debilitating, I mean an enormous analytical time sink — think months. I am often asking clients whether they wish to: 

A) Model the precise general ledger costs for logistics? 

or 

B) Make a well-researched decision? 
 
If you chose “A” you can stop reading because the rest of this blog post is about why that will lead you down the wrong path. 

At the surface “A” and “B” seem to follow one another. If I am making a good model, am I not accurately modeling my future logistics spend? Yes, with a big BUT… the precision required to make a perfect model of your financial spend can often lead you to a create a model that is erratic. Let us look at this a little deeper and see where the “precise” and the “good” deviate in a classic logistics model. 

What is a Good Logistics Model? 

A good logistics model is designed to predict the future. Yet a modeler will always start with a calibrated baseline. And the “calibrated” part of this refers to accounting costs — those costs found in an organization’s financial database. The theory goes that if a model shows the same costs as the current state, then we can trust that it will show appropriate differences when changes are modeled. 

A logistics model can be as complex or simple as a modeler wishes, however it always needs to be believable and grounded in the actual costs of a system. This blog post should make one thing clear to the modeler: the search for “accounting” level accuracy can stand in opposition to your actual goal — making a supply chain decision. It will not only cost you time to build this “perfect” supply chain model, but it will also imbed imperfections into the very mechanism of the model. 

What Makes Fiscal Accounting Accuracy Popular? 

People gravitate to their accounting numbers because of comfort — pure and simple comfort. General ledgers do not need to be explained. They reflect actual expenditures — they are immovable facts of history. They are also safe. Executives and managers alike believe their general ledgers. No one gets sent out of a conference room for repeating known accounting numbers to a group. But the actual spend last year has lots of little aberrations. 

How Can Accounting Costs Lead You Astray? 

Accounting costs can look very detailed and accurate; take an entry for an individual shipment of your product, for example. You can see the units, weights, and most importantly, the costs. These costs go directly into the accounting system. These show exactly what was paid net of discounts, accessorial, and anything else that might be tacked on. 

This means that for every origin and destination that has shipment activity, we should have a highly accurate cost for the organization’s shipment down that lane… right? 

Let me share experience from hundreds of modeling exercises. If we treat a shipment table as the definitive cost for each lane, we run into three problems with our model: 

1. Lack of statistical significance 

2. Heterogeneous data 

3. GAAP accounting methods 

Let’s delve into each one of these.

1. Statistical Significance — If I have a number, how can it be wrong? 

Let’s say you have data on hundreds, or even thousands, of trucks you paid for last year. How could this vast amount of real data go wrong? When you break them down by lane, season, and method of purchase, thousands of data points might turn into five to ten data points for a given lane — or sometimes only one shipment. As a reminder from that long-forgotten statistics class, statistical significance for a single variable starts at seven data points — just to be roughly correct. 

Now go further and ask yourself: 

– Does your shipment data have a mix of spot and contract shipments? 

– Are there data points for every season? Note: trucking in some regions has significant seasonality. 

– Is there selection bias? Your buyers or your 3PL might be taking advantage of opportunistic contracts— trucks that were cheap for a single event, but do not reflect the market price next year. 

You may have a wealth of data in aggregate but not at the level you need. Here is a way to test its value to a model — take a sample set of data for a given region and given season. Find the average and standard deviation by individual origin and destination. The variation will probably be large — I base this on my experience. The danger is that this variation is dropped from analysis once the average is found. Do some statistical sniff tests, you will probably be very disappointed in the value of this data in predicting your future spend on a lane-by-lane basis. 

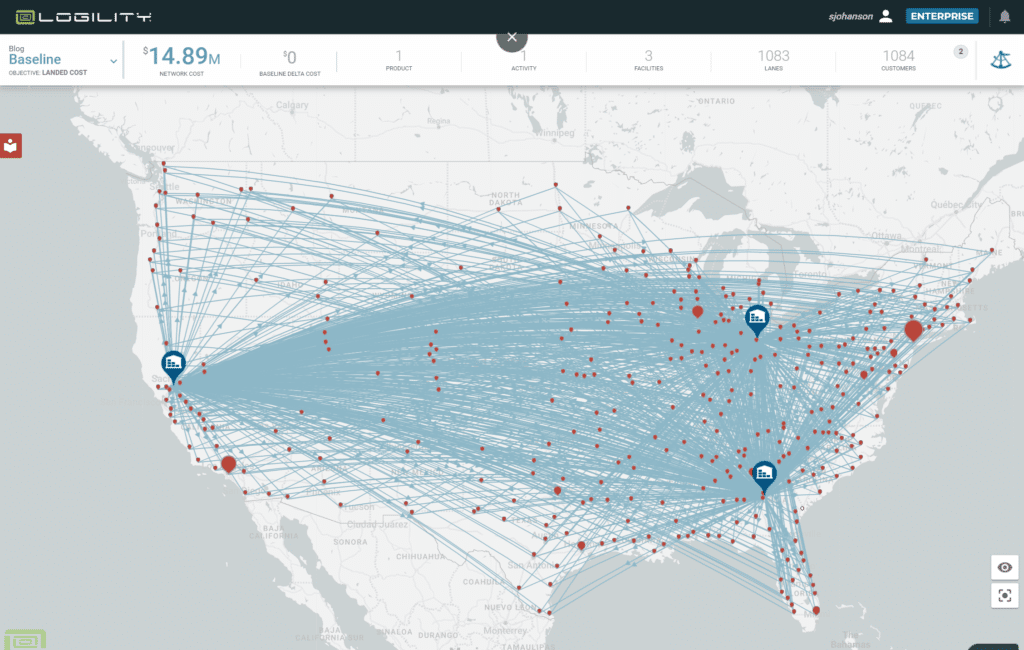
Figure 1 below visually displays what historic data looks like in an actual model. The total cost of the network exactly matched the accounting cost of $6.97MM. You can see three warehouses and almost every warehouse shipped to each destination city. We should have lots of real historical date, no need to fill in the blanks. 

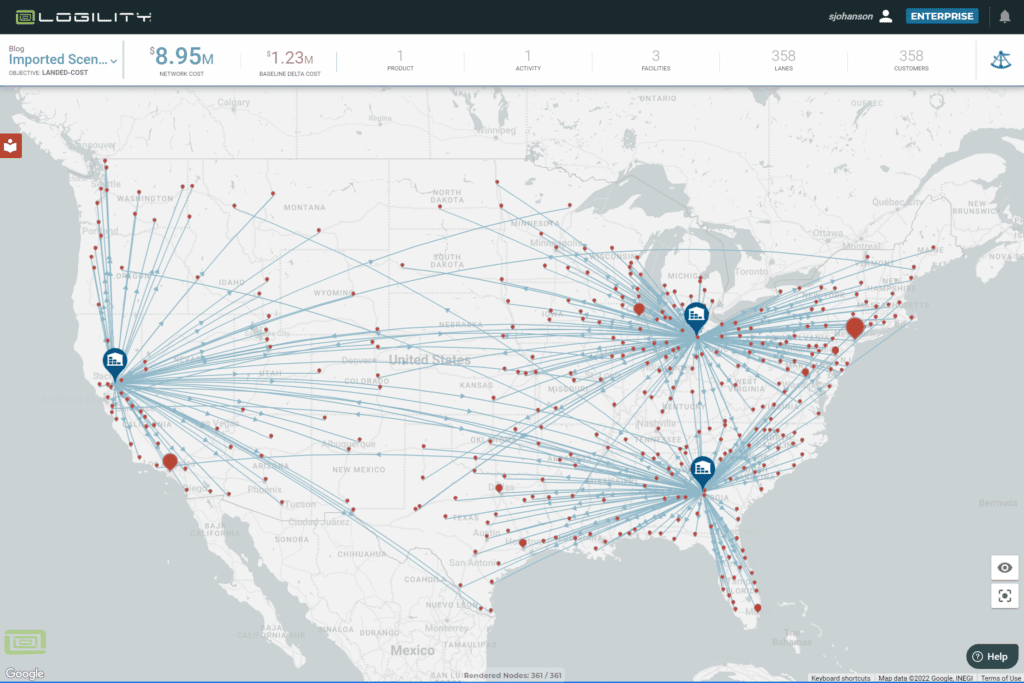
Here is where it goes wrong, Figure 2 is the same data set but optimized for the lowest cost supplier. Great, see how I saved $948K? Now look closely, find all the crisscrossed lines. Find the case where a customer node is right near the Alabama warehouse but is shipped from the Nevada warehouse. 

actual historic shipments logistics model
Figure 1 – Actual Historic Shipments
lowest cost logistics model
Figure 2 – Optimized to lowest cost lanes based on historical data

If it was not obvious before, you should now realize that optimization software acts like a passive aggressive child. If it can follow your instructions exactly and return nonsense, it will. In this case the analyst could go to each lane that did not make sense and exactly match it to actual average truck costs. Our wealth of data falls apart because lack of statistical significance throws off our model — we cannot rely on hundreds of records that present a solid average and we have not even started to add lanes that do not have any historical data. 

2. Heterogeneous Data — how do you fill in the blanks? 

The purpose of a logistical model is to answer “what-if” questions. This means something is going to change — a new port, new warehouse location, new route to the customer. Inevitably, key transportation lanes will not be found in the historical data. Modelers generally use three methods: quotes from carriers, regression analysis, and benchmark (market) data. Each of these methods will create three very different sets of data. 

Carriers can provide quotes on contract and spot rates for a defined set of lanes. These will not match your historical costs because the carrier is predicting the future costs at the same time they are trying to secure your business. Many things might not match your past discount rates and accessorial charges. But with effort and enough quotes, you can get these to be “OK.” It will take time and you will have to do it every time you make a change in the model. 

Regression analysis will turn a pile of data into a statistically significant formula. But it will also have inherent errors. Truckload rates are not uniform across any geography. An extreme example would be a port city like Los Angeles; more loaded trucks go out of Los Angeles than in. You will find that the cost from Phoenix to downtown LA is 42.5% the cost of a truck from LA to Phoenix. This is an extreme example, but you get the idea – regression formulas average out a lot of market subtleties.  

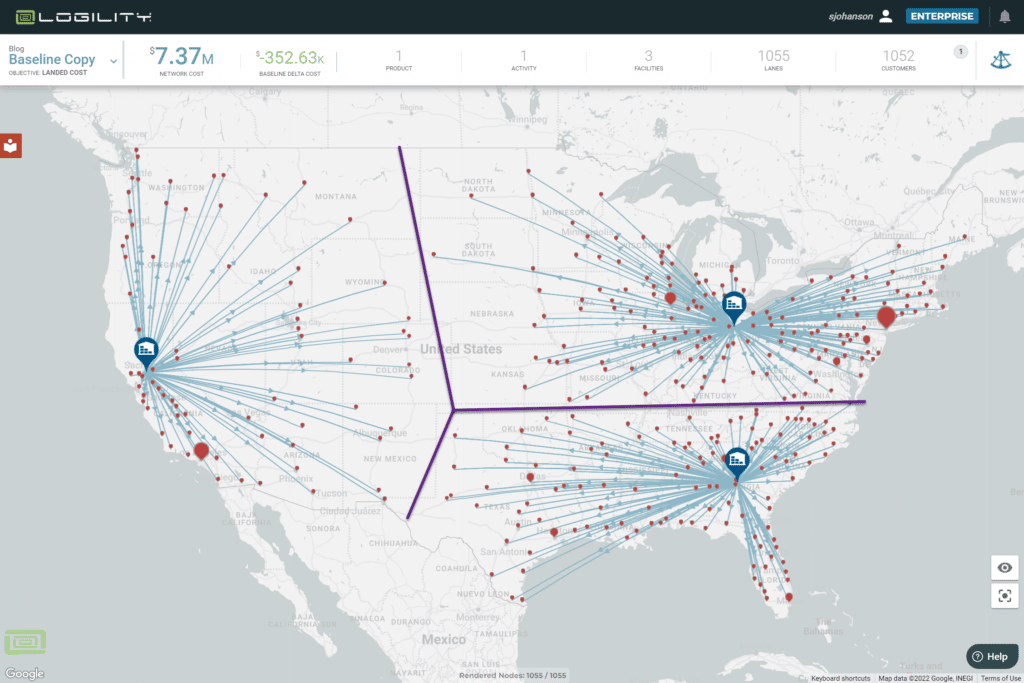
Figure 3 is an example of regression data input into the model. It makes the pretty picture you want to see — every customer is served out of its nearest warehouse. You can see the purple line showing the smooth lines of demarcation between service areas. This is easy to explain but is not correct. 

The third data set is benchmark or market data which is really another measure of historic data, but it has the advantage of being historic data across hundreds of companies and millions of shipments. It will not match a company’s historic data precisely. But if everyone is buying from the same market you can assume that everyone’s rates will regress to the same market average. 

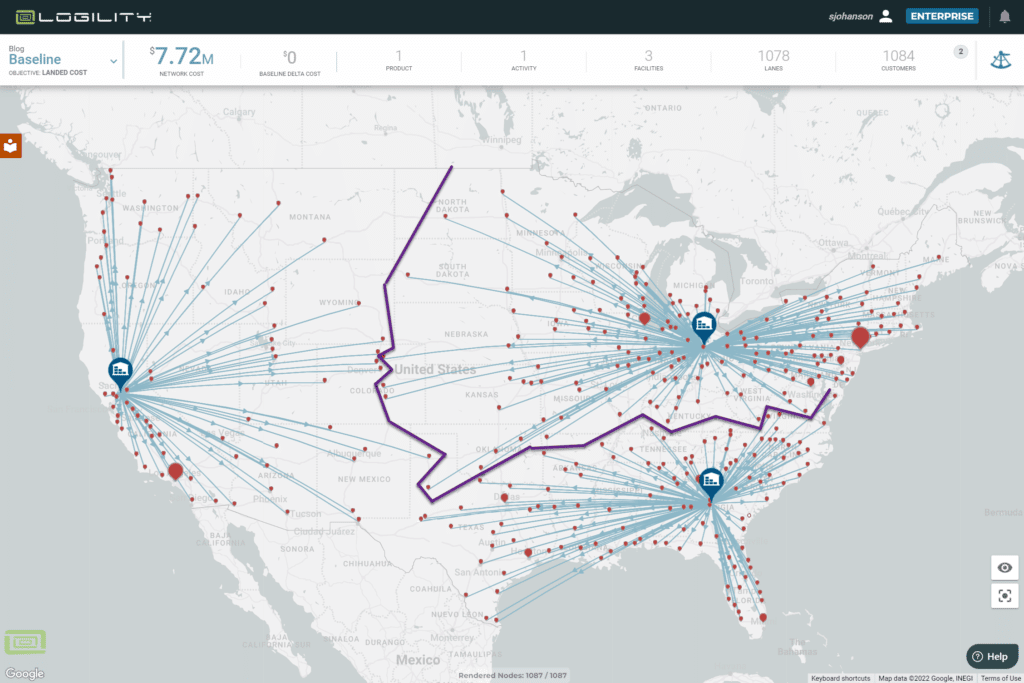
In Figure 4, you will see the customer-to-warehouse assignments are not as clean as the regression. But this is the real world and reflects the optimum use of the freight market. For example, trucks from Illinois going south are cheaper per mile than Alabama going north and east. This may be harder to explain to someone with this picture, but it has the advantage of being the most right. 

Benchmark data also has the advantage of being the same set of data for known and unknown lanes You do not have to create a Frankenstein-like data model of mixed sources to fill in all the data you need. 

regression-based costs logistics model
Figure 3 – Optimized to regression-based costs
market-based costs logistics model
Figure 4 – Optimized to market-based costs

See the table below to describe the usefulness of different data sources.

Combining two or more sets of heterogeneous data across thousands of lanes requires a miracle of analysis to get them coordinated to the point that they do not mislead your analysis.

3. Cost Accounting — How can my numbers be wrong when they match my P&L? 

Accounting is for accountants. Their objective is to balance all account totals at the end of each period. There are a lot of ways that transportation invoices are reconciled to their actual costs inside this time frame. These include corrections that might be taken at different times than the actual shipment or include discounts either ascribed to a shipment or again taken at a different point in the period. 

Manipulating all the costs, corrections, and discounts to match each shipment can be an enormous task. If you total all the truckload, LTL, and Parcel shipments into a subtotal by mode, you can believe that summed number. However, if you want each of thousands of individual shipments to be properly costed, you have a lot of work to do and might need to get your accounting department to spend some quality time on your project. 

What Should I Be Doing Instead? 

The way to build a good supply chain model is to rely on long-term market figures and averages. You can buy them from any number of rate boards or Logility provides its own proprietary data set with its SaaS subscriptions. All you need do is calibrate these numbers to your business by “benchmarking” them against what you do know. Scale the market rates up or down and proceed to answering your question. 

The true value of a logistics model will be that it trades off high-cost modes like LTL against low-cost modes like FTL. Or that inventory will be traded off against transportation. As long as your ratios are calibrated, you will get the right answer.  And a good supply chain leader will value the right and defensible answer over detailed accounting precision — and they will appreciate that you answer the question sooner rather than later. 

Additional reading:

Every business ‒ regardless of size, industry, or market ‒ can relate to the same challenge: customer frustration. It’s incredibly complicated to pinpoint when an order will ship and when it will arrive. Components and raw materials are still in short supply, logistics services remain delayed, and demand shifts and shocks are consistently unpredictable. Customers are looking for answers. 

For Johnson Controls, a significant component of the answer begins with being capable to plan and turn those “plans” into customer promises. 

During this year’s Gartner Supply Chain Symposium, Hamish Scrimgeour, Global Director of Planning and S&OP at Johnson Controls, shared how his team is perfecting its ability to plan by converging and integrating business systems to orchestrate the supply chain across multiple global sites. 

“We all need to aspire to improve supply chain planning. There’s no way you can orchestrate a value stream until you’ve got it all integrated,” Scrimgeour said. “We must think outside the site and move the supply chain as a single network.” 

Change Fuels the Need to Do Things Differently 
 
It’s well understood that the supply chain operations of the past, for the most part, have been good – but there’s always room for improvement. As the dynamics of supply and demand continue to evolve, businesses need to find ways to adapt quickly and pivot resources intelligently. And solutions and systems are part of that change. 

Even though Johnson Controls is more than 150 years old, it has the heart of a young startup. Through its comprehensive digital portfolio OpenBlue, Johnson Controls offers seamlessly integrated products and solutions in building automation, building controls, refrigeration and air conditioning, as well as security, fire protection and fire suppression. The pure play smart sustainable buildings company is always focused on innovative solutions that make things smarter, safer and healthier, as well as more cost-effective, sustainable, and secure. That trait is what Johnson Controls is all about, whether designing a new thermostat or redesigning internal processes. 

Serving 4 million customers in 150 countries with a global team of 100,000 experts across more than 100 locations (manufacturing sites and distribution centers), Johnson Controls’ ability to plan is critical. Its products and solutions are sold in commercial and residential markets to B2B and B2C buyers across six continents, presenting unique customer expectations, go-to-market strategies, and planning challenges. 

“We have the entire gamut of manufacturing strategies,” remarked Scrimgeour. “Depending on the product design and customers, each subsidiary plans differently in little ways to address, for example, production scale, demand horizons, material risks, and customer value that is unique to them. And with an annual multi-billion spend on 6,000 vendors, approaches may vary based on the supplier’s size.” 

Despite all these differences, Johnson Controls chose to integrate supply chain planning. Scrimgeour recounts the line of thinking behind the decision: “We’ve been using Logility solutions since 1997. But when our merger with Tyco, also a Logility customer, was completed in 2016, we saw a great opportunity to integrate the planning technology, processes, and data between the two companies.” 

Transformation Begins with Convergence 

Businesses cannot run 60 ERPs and expect to be on the same page – the same is true when every subsidiary has its own approach to demand and supply planning. But that was the situation that Johnson Controls wanted to change for itself. 

“Converging all these ERPs and solutions is a big effort; however, it’s the best way to tie our supply chain planning across the entire business,” Scrimgeour said. “Every subsidiary and business unit has different requirements. But all of us agreed to enhance and continue working with Logility with a vision for end-to-end supply chain planning that was transparent, orchestrated, and optimized.” 

The first step of the transformation focused on demand planning. The three-step process of booking, releasing, and building products is managed by one planner. Johnson Controls used Logility solutions to advance its supply chain planning processes from a demand perspective, encompassing capabilities for forecasting orders, tracking and tracing products, and identifying value-added opportunities.  

The company also added a twist to this digital initiative – revenue recognition. In most cases, companies produce a widget and get revenue from it immediately after the purchase transaction. Johnson Controls’ engineer-to-order model, on the other hand, recognizes revenue in milestones throughout the building process, which means the value of every order must be monitored along the way. 

As Johnson Controls moves further in its transformation, its planners will be able to forecast the workflow, timeline, and milestones for orders ahead of time.  

“That’s one of the game changers this initiative with Logility will bring over the next few years,” highlighted Scrimgeour. “Getting orders booked, released, produced, and delivered requires much more than execution excellence. A large variety of parts, manufacturing strategies, and marketing programs must be managed seamlessly.” 

In addition to elevating its demand planning, revenue recognition, and supply forecasting capabilities, Johnson Controls is balancing its inventory more effectively. The company has gained greater visibility into on-hand inventory across its distribution centers, with the assistance of its data analytics partners. Now, it can compare order trends with inventory quantities to better fill demand and optimize production capacity. Scrimgeour expects that distribution centers will be stocked with the right mix of stock and units based on demand close to them. 

“Everyone Knows Where Everything Fits” 

Johnson Controls is a prime example of the true potential of integrated planning. The company is motivated to cover all aspects of its supply chain planning processes across all value streams and manufacturing systems. But more importantly, employees can work together more collaboratively, intelligently, and strategically – irrespective of their subsidiary. The company sees it as a chance in a lifetime to be really at the foundation of redesigning supply chains that are going to be much more resilient, focused on ESG, and ultimately achieving “what we are all setting out to achieve.”

Scrimgeour concludes: “Pulling everything together into our manufacturing system will be enormously powerful for us. When centralizing our control tower and planning, we are entering a new era where everyone knows where everything fits together.” 

Contact us today to learn more about integrated planning and the Logility Digital Supply Chain Platform.

Agility and speed are on every supply chain executive’s mind. But their well-placed concerns are much more than a reaction to recent shocks in supply disruptions, demand fluctuations, changing customer preferences and unpredictable market conditions. It’s more like a reckoning for broad ERPs and legacy point solutions that were never designed to meet the needs of a world of fast-paced change and large data volumes. But this is not the time to fall into the trap of overhyped technology that promises the same capabilities in a different package. Instead, supply chain organizations need a supply chain platform that scales as needs change and introduces new capabilities as operations grow more advanced – all while maintaining a level of consistency and reliability that users can trust.

For many businesses worldwide, that platform is Logility. Wondering why a company would pick a midmarket supply chain platform over a wide range of big-name, large-scale software providers? Let me share their reasons.

1. Supporting top-notch service with less risk and cost

As the fifth-largest food and beverage company in the world,  The KraftHeinz Company manages a massive volume of products, some of which are highly seasonal with short shelf life and high obsolescence. But with Logility’s inventory planning and optimization solution, the company is cutting through that complexity and optimizing their inventory, leading to upwards of $20 million in savings, and 2% higher service levels with minimal stock.

2. Driving true visibility with a fast ERP integration

Fender is building a more responsive supply chain based on real-time forecast results, direct visibility into the impact of supply constraints, and easy integration with pre-existing SAP software. With Logility, the world’s number one maker of stringed instruments and solid-body guitars can see changes from one week to the next in the context of its strategic plans. With this visibility, the company has gone from its previous 12 decision points to more than 52 decision points a year – paving the way to a seamless expansion through organic growth and acquisitions.

3. Finding alternate sourcing and using excess stock

With an extensive product portfolio, MilliporeSigma needed a platform that could keep up with the pace of its business while helping to ensure orders were getting out the door in the same day. Initially, the flexibility and speed of the platform immediately optimized the entire supply chain by looking at factors such as ocean freight and lot sizes and increasing forecasting accuracy. But soon after, the life science and technology company took its supply chain to the next level by increasing customer service levels, optimizing inventory, and collapsing cash-to-cash cycles.

“Logility keeps up with the pace of our business,” says Jeff Killion, director of global planning at MilliporeSigma. “The ability to get orders in the same day gives us a huge competitive advantage.”

4. Replacing a legacy ERP with a complete transformation

With Logility in place, The Leatherman Tool Group enjoyed its most profitable year in a decade – after decommissioning its legacy ERP. Accurate, actionable information is now available across the supply chain in real time, answering critical questions such as why certain events happened and how to address them. This operational transparency allowed the Leatherman team to pinpoint formerly hidden costs that drained profits, such as vendor compliance charges.

5. Consolidating intelligence with prebuilt solutions

Before implementing Logility, The Carlstar Group relied on a fluid mix of ERP-generated data, error-prone spreadsheets, and unreliable anecdotal narratives to operate its sales, operations, and IT departments. Now, after consolidating data across three disparate systems onto a single platform, the manufacturer of specialty tires and wheels is leveraging visible, shared, and trusted intelligence to understand customer buying habits, give customers a better view of its products’ value, and spot trends earlier to anticipate future opportunities and risks.

6. Operating with flexibility across a dynamic network

With Logility, Sonoco Products Company has revolutionized its scheduling process across its ever-changing manufacturing environment. The company optimized its schedule based on machine, personnel, tooling, and inventory constraints. Doing so helped improve customer service levels, compress lead times, and increase reliable product availability, while increasing scheduler efficiencies and effectiveness and responding quickly to dynamic customer and market needs.

“Logility invests to stay ahead of market needs and understands how those changing needs impact our business. You just don’t get that depth of supply chain planning experience with an ERP solution alone,” says Sonoco’s director of global business technology.

7. Providing an integrated global view on a common platform

A desire to better handle an immense SKU portfolio with a solution that can be implemented quickly convinced CooperVision to choose the Logility’s digital supply chain platform. The company gained an integrated view of global operations with its first common, enterprise-wide platform. Although multiple ERP systems are still in place at CooperVision, it has made significant strides in gaining supply chain visibility worldwide.

8. Uniting multiple ERP systems to make all data visible

At Sensient Colors, not all its business units were on the same ERP system and could access and use the same data. When the Logility platform was adopted, the global manufacturer and supplier of natural and synthetic color solutions quickly saw the amount of data that were being left unused and identified new insights and actions to drive critical decisions based on actual business conditions. Examples include recommending inventory levels to match target service levels, holding back production at intermediate or bulk levels, and understanding how demand variability will impact lead times.

Our Customers’ Success is Our Pride – and Mission

While every Logility customer has a unique reason for choosing our platform, they all have one thing in common: a purpose-driven passion for building supply chains that make people’s lives better. Whether they’re delivering a toy to a child or raw materials to support millions of vaccine doses to a major city or rural town, our community of more than 1,250 customers is revealing the true power of supply chain digitization.

That’s the beauty of working with Logility. We witness a world that is growing stronger, better, and faster when a supply chain organization eschews the constraints of traditional digitization to seize new opportunities with a platform that moves with them.

Check out our amazing gallery of customer success stories to learn how leading businesses across many industries are building responsive, resilient supply chains with Logility’s digital supply chain platform.