The evolution of computers has played a large role in the rise of forecasting capabilities. The first commercially available demand planning system was introduced to the market in the mid 1970’s by American Software. At that time only the largest companies could afford robust demand planning systems run on mainframe systems managed by a dedicated demand planning specialist. Over the last 45 years, demand planning solutions have become more powerful, easier to use and more affordable allowing any size business to gain value through their use.
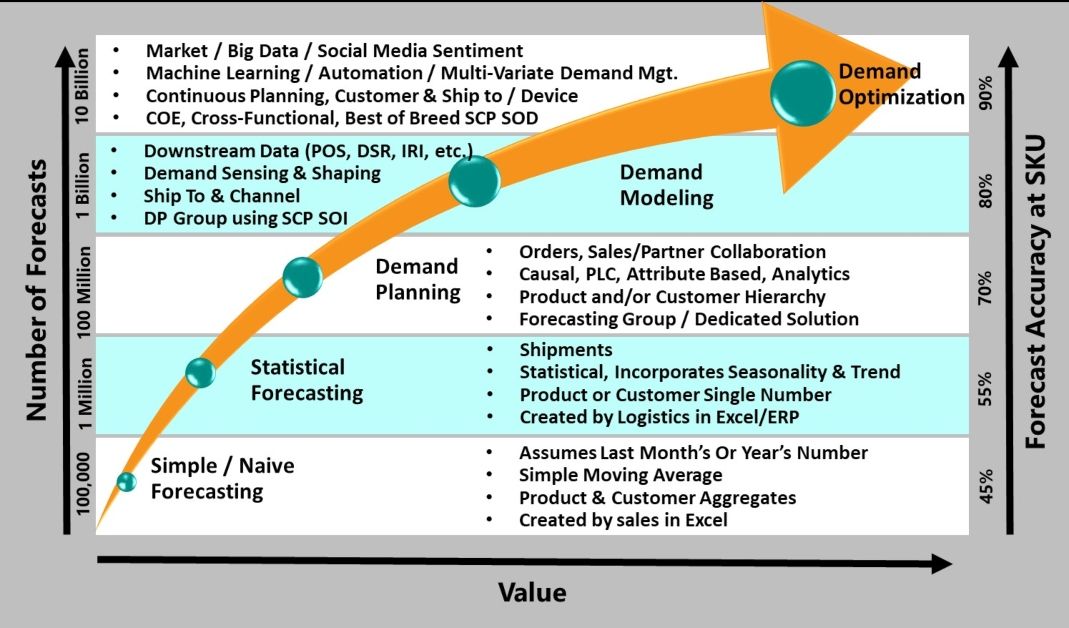
Maturity curves have become a popular way to visually benchmark your company’s state of development in a particular business capability. By comparing your current capabilities against typical capabilities at a certain maturity level you can develop a game plan to move from one level to the next. This post discusses the Demand Optimization Maturity Curve.

SCP – Supply Chain Planning
SOD – System of Differentiation
SOI – System of Innovation
POS – Point of Sale
IRI – Syndicated Data Source
DSR – Demand Signal Repository
PLC – Product Life Cycle Planning
MVDM – Multi-Variate Demand Management
Source: Logility, Inc.
The Demand Optimization Maturity Curve starts at level (1) Naïve Forecasting, the lowest level of maturity, and ends at level (5) Demand Optimization, the highest level of maturity. Today even after 40 years of demand planning solutions most companies are below level (3) Demand Planning. With advancements in computing power and corresponding development of more advanced solution capabilities the ability to reach a level (4) Demand Modeling or even level (5) Demand Optimization maturity is more attainable today than it has ever been.
As your organization climbs the Demand Optimization Maturity Curve, the value of the process increases through improvements in forecast accuracy, decreases in data latency and the ability to forecast accurately at lower levels of aggregation. Each maturity level builds on the previous through the improvement of planner skills, enhancements to process and organizational structure, and the enablement of new capabilities through advanced solutions.
The information provided at each level in the Demand Optimization Maturity Curve describes the typical maturity at that level across four dimensions. From the bottom up these dimensions are organizational structure, the level at which forecasts are created, the forecast techniques used and the data utilized to create forecasts. It is possible to be at different levels of maturity across these four dimensions. For instance, you could be at the Demand Planning level from an organization standpoint having a dedicated group and solution but still be at a Statistical Planning level when it comes to the level at which you forecast.
Most supply chain professionals know that the ability to generate an accurate forecast has a significant impact on the accuracy of almost all other business plans. Forecast accuracy directly impacts an organization’s ability to satisfy customers, manage resources and grow the business cost effectively. An improvement in forecast accuracy—even just one percent—can have a ripple effect across the business, including significantly reducing inventory buffers, obsolete products, expedited shipments, distribution center space, and non-value added work. In turn, these improvements can translate into higher customer fill rates, customer satisfaction and ultimately more revenue with higher margins.
With this in mind, most companies are on a never ending quest to improve their ability to predict demand for their products and services. We hope that this Demand Optimization Maturity Curve will renew your conversation on how you can improve your demand planning capabilities.
Additional reading:


