
Short on Time? Here’s a Quick Summary
- Demand forecasting models use historical sales, market signals and other relevant data to predict future customer demand and support planning decisions
- Different demand patterns require different forecast models since seasonal, trend-driven and intermittent demand each behaves differently
- Ensemble forecasting combines and weights multiple models to improve accuracy and reduce reliance on a single approach
- Different accuracy metrics, such as mean absolute percentage error (MAPE), root mean squared error (RMSE) and mean actual error (MAE), reveal different types of forecasting error
- Forecasts can degrade as demand patterns change, so continuous monitoring helps identify model drift and determine when adjustments are needed
- Forecast Value add governance helps planners trust and trace forecasts through model versioning, audit trails and data governance
Introduction
Every supply chain decision starts with a question: What will customers need next? Get the answer wrong, and you could end up with excess inventory, production disruptions, missed sales or costly last-minute adjustments. That’s why accurate demand forecasting is so important to effective supply chain planning.
Demand forecast models use historical sales, market signals and external variables such as promotions, weather and macroeconomic conditions to predict future customer demand. But forecasting isn’t as simple as choosing a model and letting it run. Different demand patterns require different approaches, and forecasts can lose accuracy as market conditions change.
In addition, selecting the right forecasting model is only one part of the forecasting process. Forecasting systems must also determine the appropriate level of granularity, including which product, customers, channels or locations should be analyzed together. This is typically done using supervised learning (e.g., product categories, or unsupervised learning, e.,g., clustering techniques). When forecasts are generated for groups of products or customers, systems must also determine how to disaggregate higher level forecasts into the individual product level, while ensuring consistency across levels.
In this guide, we explore how demand forecast models work, how to evaluate their performance and why ensemble approaches can improve accuracy. We also look at how to detect model drift and structure forecasts so they remain reliable inputs for downstream planning decisions.n
Understanding Demand Forecasting Models
Most supply chains involve a range of products, each with its own demand pattern. These patterns can vary due to seasonality, promotions, campaigns or new product innovations that change demand for an existing product. As a result, different demand patterns may require different forecasting models to better predict when customers will place orders and how much they will buy.
Because demand patterns are so variable, forecasting systems rely on multiple model families to offer sales and operations teams a range of approaches to predict customer needs. Commonly used model families include autoregressive integrated moving average (ARIMA), exponential smoothing, tree-based machine learning (ML), and neural networks. The table below describes each model and provides some common use cases.
| Model Name | What It Does Well | Common Use Case |
|---|---|---|
| ARIMA | Identifies patterns in historical demand and uses them to predict future demand | Established products with relatively stable demand and limited external influences |
| Exponential smoothing | Applies exponentially decreasing weights to older observations to prioritise recent sales data | High-volume, fast-moving items with strong recurring seasonal patterns where recent sales history is the strongest predictor |
| Tree-based ML | Captures complex relationships between demand and factors such as pricing, promotions and holidays | Products where external factors have a significant influence on demand |
| Neural networks | Identifies complex patterns and relationships across large amounts of data | Large product portfolios with complex demand patterns and multiple demand signals |
As you can see, no single model consistently performs best across all demand profiles. Each approach has strengths depending on the demand pattern and the data available for the model to ingest.
Why Use an Ensemble Approach?
Now that we’ve covered what demand forecasting models are and discussed some common model families, let’s turn to the important question: What is the right approach for your business?
Choosing a single “best” forecasting model for a product (or portfolio of products) isn’t straightforward and can create significant forecasting errors. Your teams may not know the underlying demand pattern, and even if they do, that pattern can change as customer behavior, promotions, seasonality and market conditions shift.
For example, a model that performs well for seasonal products where demand spikes predictably at certain times of year may perform poorly for intermittent-demand products such as spare parts. Similarly, a model that works well for near term forecasting may be less effective over the medium or long term. Applying the same forecasting approach across different demand patterns and time horizons could result in inaccurate forecasts, excess inventory or missed demand.
Modern forecasting systems can address these challenges by combining the strengths of multiple forecasting models, an approach known as ensemble forecasting. Rather than asking your planning team to determine which model will work best for every product or time horizon, the forecasting system can evaluate different approaches, learn from their performance and combine their forecasts. This can help smooth fluctuations in forecasts and incorporate information from multiple sources into the overall plan.
In the example above, an ensemble could combine forecasts from models that capture seasonal patterns with models that respond better to the irregular demand patterns of spare parts. It could weight different models according to how well they perform on the specific sales data and produce a more reliable and flexible forecast.
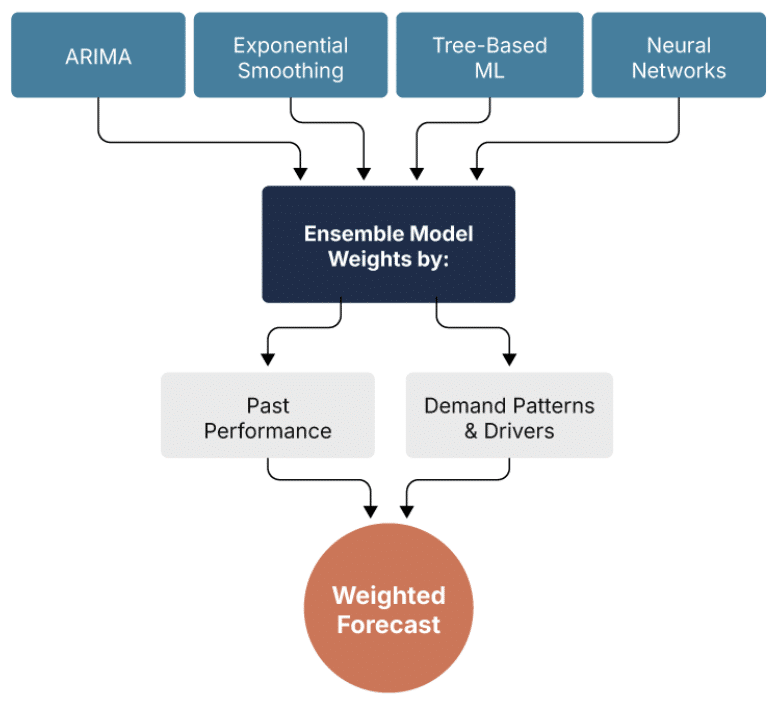
How ensemble forecasting works
The result is a more accurate forecasting approach that can adapt to different products and changing demand patterns while minimizing disruption for downstream supply chain or operational activities. For planners, that means better-informed decisions about inventory, production and procurement and less firefighting around excess inventory or missed demand.
How to Measure Forecast Accuracy
Producing a forecast is only part of the process. Once the models are in place, you need to know how well the forecast is performing and whether its errors could create problems downstream. Some common metrics used in this process include the following:
- Mean absolute error (MAE) measures the average magnitude of forecast errors
- Root mean squared error (RMSE) heavily penalizes large, unexpected forecast misses
- Mean absolute percentage error (MAPE) shows forecast error as a percentage of actual demand
- Weighted mean absolute percentage error (WMAPE) measures percentage error while giving more weight to higher-volume or higher-value products
- Bias shows whether forecasts consistently overestimate or underestimate demand
Connecting metrics to business context
Each of the metrics above has different strengths, weaknesses and purposes. MAPE, for example, treats over-forecasts and under-forecasts equally, so what may appear to be an acceptable MAPE value may actually exacerbate challenges with order fulfillment or distribution planning. Meanwhile, bias hides error magnitude because positive and negative errors cancel each other out.
An additional aspect to consider is the forecast horizon over which accuracy, error and bias are measured. For example, if a production lead time is three weeks and the raw materials procurement lead time is two months, then the business should track forecast error over both three-week and two-month periods. Without this alignment, such blind spots can negatively impact customer experience and increase supply chain costs.
It is important to understand how each metric fits into your overall business strategy. The metric that matters most depends on what you are trying to optimize for. Let’s take a look at a few scenarios:
- If your biggest concern is overforecasting and excess inventory, bias can show whether you consistently forecast more demand than you actually see, e.g., performance by business unit. You can pair it with MAE to understand the typical size of those errors and, if needed, translate the excess units into inventory or working capital costs.
- If large forecast misses are creating stockouts, capacity problems or service-level issues, RMSE can help highlight those unusually large errors by giving them more weight.
- For high-volume products or mixed portfolios, MAPE and WMAPE can provide a useful view of forecast error as a percentage of demand. WMAPE can be particularly useful when you want higher-volume products to have a greater influence on the overall accuracy measure.
- For low-volume or intermittent demand, MAE can provide a more meaningful view of forecast performance because percentage-based metrics such as MAPE can become unstable when actual demand is very small.
The goal is to connect forecast error to business consequences that matter most, whether that is customer service levels, working capital tied up in excess inventory, stockouts, capacity issues, or service levels. If you’re uncertain about which metric to choose for your use case, the decision tree below provides a helpful starting point.
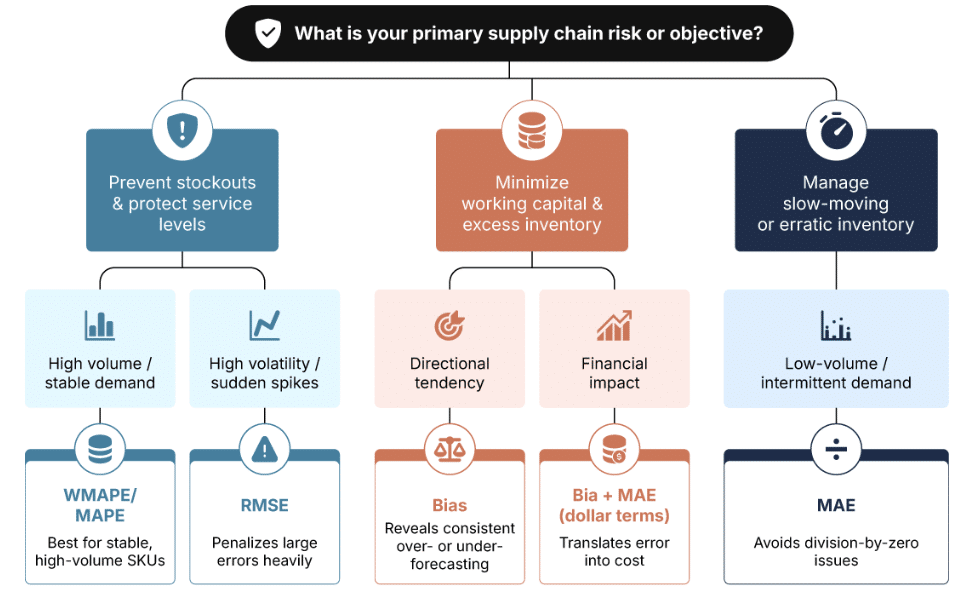
Demand forecasting metric decision tree
Finally, it’s important to define carefully which metric targets are considered “acceptable” for your business. For example, a 10% MAPE target is realistic for high-volume consumer products but unrealistic for low-volume spare parts. Set error thresholds based on the cost of being wrong and your service level commitment to customers.
How to Keep Forecasts Reliable as Demand Changes
Measuring accuracy tells you whether your forecast is working today. However, demand patterns are not static, and forecast accuracy may degrade over time.
There can be several reasons for this. Market conditions shift, seasonality changes, or new competitors emerge, all of which can disrupt customer and consumer purchasing behavior. A model that performed well three months ago can appear to trend towards over-forecasting or under-forecasting. This is referred to as model drift, and each type of drift requires a different response.
How to Detect and Respond to Drift
Modern forecasting systems monitor for drift in real time by using approaches like tracking signal, MAPE trends and exception flags. They track metrics over rolling time windows to monitor any deviations from the expected range of metric values. When a tracking signal exceeds a threshold, an alert is sent to the forecast owner, who then checks the model or the underlying data. When systemic bias appears, the system can flag exceptions for planning teams to review. This early detection allows you to address changes in demand patterns before upstream and downstream systems are caught off guard and forced to react to unwelcome surprises.
When drift is detected, there are specific steps you can take to address it:
- Review the forecast assumptions to identify any material changes to how the assumptions were formed.
- Validate that your input data hasn’t changed or degraded by checking for errors or inconsistencies.
- Ensure that forecast drivers are still applicable. E.g., promotions, weather or new competitor information that may be used by the forecasting engine are still relevant and updated
- Evaluate whether model parameters need adjustment. In some cases, retraining the model on recent data will inform the model of demand pattern changes, and the model will determine which parameters need to be adjusted. The key is acting quickly when drift is detected to ensure supply chain impacts are minimized by demand pattern changes.
AI vs. Human Involvement
The question of how much to automate versus how much to leave to human review will depend on the behavior of the SKU, the capability of the system used to generate forecasts and the operating model and risk tolerance of the organization. Fully automated systems can flag drift quickly and take action to address it based on established rules and policies. However, human expertise is critical for understanding whether drift is a temporary anomaly or a more systematic challenge that requires model adjustment.
Forecast governance should also measure forecast value added by comparing system-generated forecasts against a naive forecast baseline and evaluating whether human adjustments further improve forecast accuracy. The best approach combines system monitoring with human judgment, with clear guidelines to properly define the roles and responsibilities of humans and machines. Your forecasting system should alert you to drift, and humans should use their judgment as subject matter experts to determine if any intervention is needed to ensure demand forecast integrity.
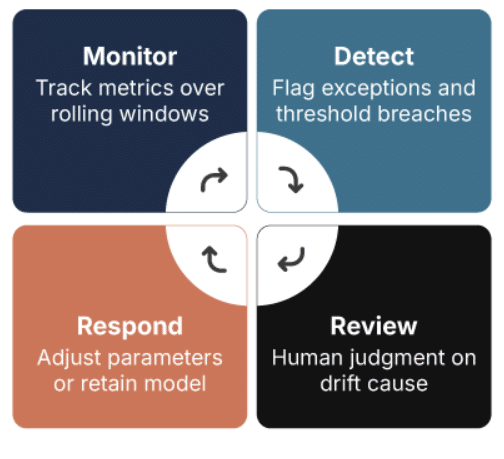
Detecting and responding to model drift
How Forecasts Flow into Planning and Decision-Makings
Once a forecast system generates a forecast, it must be structured for downstream use. A supply chain will conduct a consensus planning process where the various functions that have created forecasts will convene and agree on a combined forecast that will turn into the demand plan. Planners lead these sessions and capture from each functional area which model version produced their forecast and track the audit trails showing assumptions and parameters.
Forecasts also flow into planning at different time horizons and aggregation levels:
- Short-term forecasts (weeks to months) inform order fulfillment and inventory activity, like stock transfer orders and materials management
- Medium-term forecasts (months to quarters) drive demand planning and inventory targets and are used to inform capacity planning decisions
- Long-term forecasts (quarters to years) support sourcing strategies and supply chain network design configurations
Each time horizon may have different variables influencing the accuracy of a forecast, so you may use a set of models to create long-term forecasts, and another set of models as you move into the short-term.
To support this flow of information, forecasting systems must maintain clear versioning and data governance. Model versioning ensures that you can recreate past forecasts or roll back to a previous, more stable model if a newer model starts behaving erratically. Audit trails document forecast assumptions to enable root-cause analysis when a forecast does not achieve the intended result. Data governance ensures forecast data integrity by ensuring that historical data fed into the forecast models is clean, consistent and reliable. Together, these elements ensure that downstream teams build trust in the forecast and use it in their decision making and operational activities.
Last thoughts
Demand forecasting models are not one-size-fits-all. Different SKUs, categories, and markets exhibit different demand patterns, and those demand patterns vary over time. Ensemble forecasting combines the strengths of multiple models to improve the forecast accuracy of the portfolio, and continuous monitoring for drift ensures forecasts remain reliable.
The complexity of managing forecasts means that supply chains benefit from the use of technologies that evaluate multiple models to identify which is the best fit for an observed demand pattern. This eliminates the need for manual model selection, which has a tendency to be error-prone and time-consuming. The intelligence and consistency of demand forecasting technology is what separates an oversimplification of model creation from a rigorous exercise of ensemble model curation and automated drift detection.
Logility’s forecasting solutions incorporate ensemble approaches, automated model selection, and continuous monitoring. The Logility Supply Chain Management suite also includes DemandAI+, a purpose-built platform that supports supply chain digitization through an AI-first methodology. By using ensemble modeling and incorporating all drivers of demand, it goes beyond traditional forecasting by combining multiple models to deliver more accurate, tailored forecasts.
To see how your organization can partner with Logility and benefit from lower supply chain costs and higher customer service levels, contact us or request a demo.